

The Problem With Manual Risk Tracking
Managing quantitative risk across multiple categories is demanding enough without the added burden of maintaining fragmented spreadsheets. For Meridian Capital, that was exactly the situation — analysts were manually compiling data, recalculating risk scores by hand, and producing reports that took far longer than they should. The process worked, technically, but it was slow and left too much room for inconsistency.
The ask was clear: build a single Excel-based environment that could automate the routine work and give the team a reliable, visual view of their risk exposure — and do it fast.
Designing the Architecture
Before writing a single formula, we mapped the full workflow. We needed to understand how risk categories related to each other, what the scoring logic looked like, and where the manual steps were concentrated. That groundwork shaped the entire build.
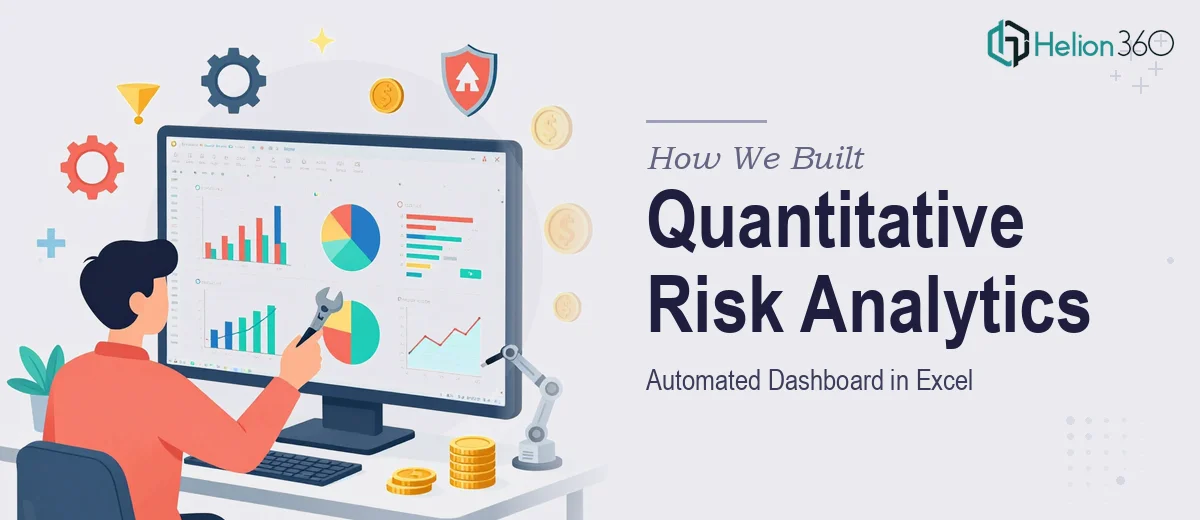
The spreadsheet was structured in three distinct layers: a controlled input section, a calculation engine built on advanced Excel formulas, and a dashboard output layer with dynamic charts and visual risk indicators. Dynamic tables meant the model updated automatically as new data came in — no manual recalculation required. Every input field was validated to prevent data entry errors from propagating through the model, and every formula was documented for maintainability.
What the Dashboard Actually Does
The finished tool handles risk scoring across multiple categories simultaneously. Exposure levels are surfaced visually on the dashboard, making it easy to identify where attention is needed without digging through raw data. The chart layer was built to support internal reporting directly — outputs are clean enough to drop into a presentation without reformatting.
Helion360 also stress-tested the model against edge cases before handoff, ensuring the formulas held up under unusual inputs. A walkthrough session was included so the team could operate and maintain the tool independently going forward.
Measurable Shift in How the Team Works
What used to take hours of manual compilation now updates in real time. The team gained back meaningful capacity — time that had been absorbed by routine data work was redirected toward analysis and strategic planning. The model scaled cleanly across the risk categories it needed to cover, and the client's analysts were able to take full ownership of it from day one.
The project came in on time and within scope. If your team is dealing with a similar gap between the analysis you need and the tools you currently have, Helion360 builds exactly this kind of structured, automated financial tooling — and we know how to move quickly without cutting corners.
Working With Helion360
Projects like this one sit at the intersection of financial logic and Excel engineering — they require both precision and a clear understanding of how analysts actually work. Helion360 takes on complex, time-sensitive builds like this regularly, and we bring the same structured approach every time. If you're looking to automate a risk model, a financial dashboard, or any Excel-based analytical tool, we're ready to get started.