How I Built a Dynamic KPI Scorecard in Excel to Track Employee Performance
Learn how I built a dynamic KPI scorecard in Excel to track employee performance metrics like sales targets, satisfaction scores, and project completion rates.
Read MorePresentation design, digital marketing & market research for businesses worldwide.
Loading blog…
Learn how I built a dynamic KPI scorecard in Excel to track employee performance metrics like sales targets, satisfaction scores, and project completion rates.
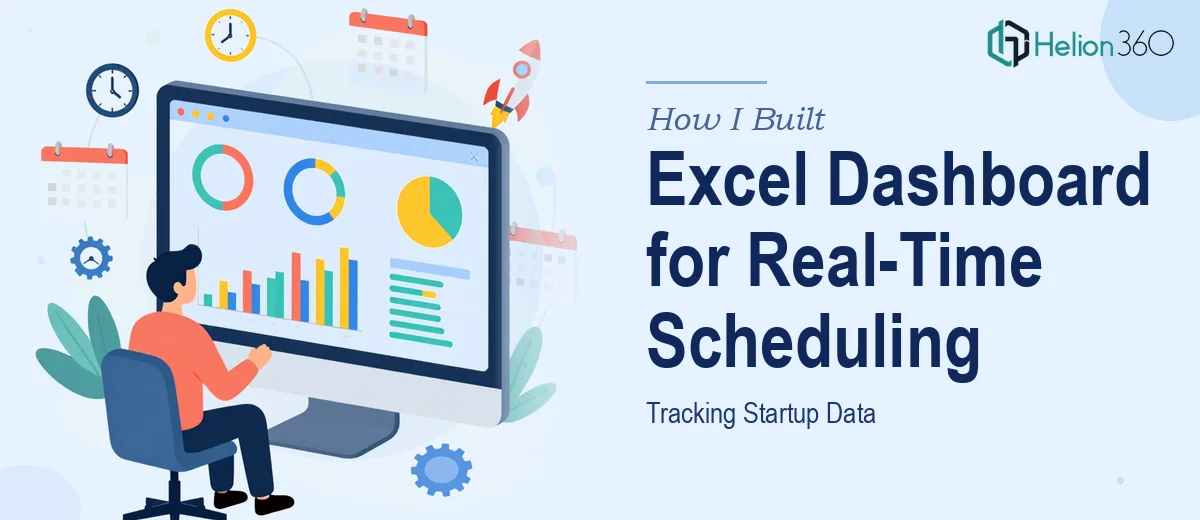
Read MoreLearn how I turned raw scheduling software data into a clear Excel dashboard tracking appointments, bookings, and trends — with help from Helion360.
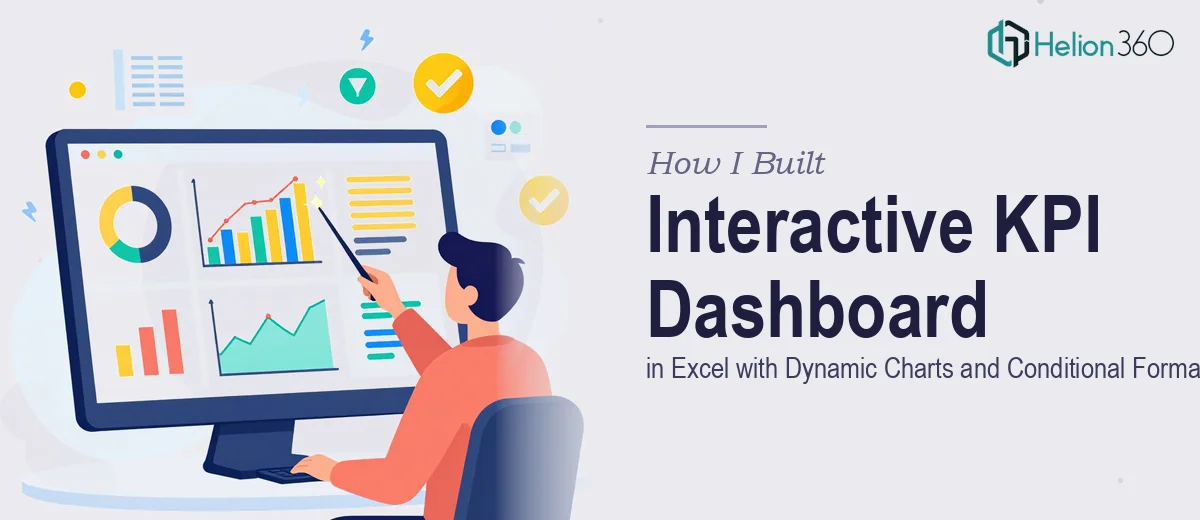
Read MoreLearn how I built an interactive KPI dashboard in Excel with dynamic charts, pivot tables, and conditional formatting — and when I called in expert help.
Read MoreI needed a functional calculator in Excel with a clean UI. Here's how I tackled it with VBA and where I got stuck before getting expert help.
Read MoreHow I handled client communications, scheduling, and legal support for a law firm — and what I learned when the workload grew beyond one person.
Read MoreHow I handled daily share trade entries in Excel, scaled from 10 trades to variable volumes, and got accurate financial data with help from Helion360.
Read MoreHow I turned messy Google Sheets into a clean, scalable financial system for a growing business — tracking expenses, invoices, and reports with clarity.
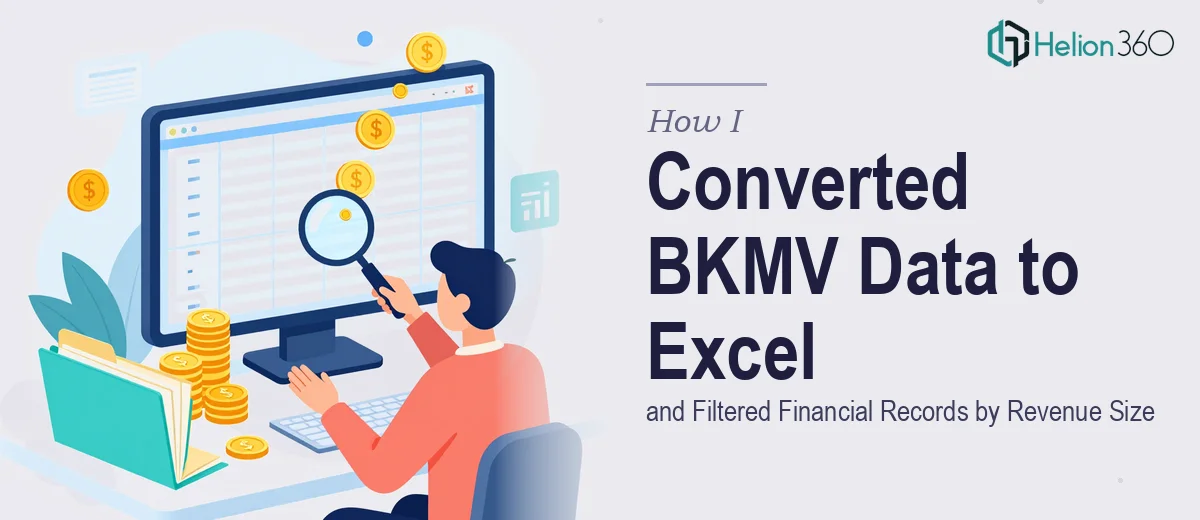
Read MoreLearn how I converted a BKMV data file to Excel, filtered companies by revenue size under $10M, and structured clean financial records for analysis.
Read MoreLearn how I managed a structured Bitrix24 customer notes import from Excel, avoided duplicates, and matched the CRM schema accurately with expert help.
Read MoreHow I tackled a complex big data ETL pipeline converting JSON to Excel using Python — and what happened when the scale of the problem exceeded my capacity.
Read MoreI had a month's worth of data in Excel with a report due the next day. Here's how I got it cleaned, formulated, and charted in under 24 hours.
Read MoreLearn how I extracted data from interactive charts into clean Excel tables using web scraping — and how expert help made the process faster and more accurate.
Read More