

The Problem That Started With a Simple Request
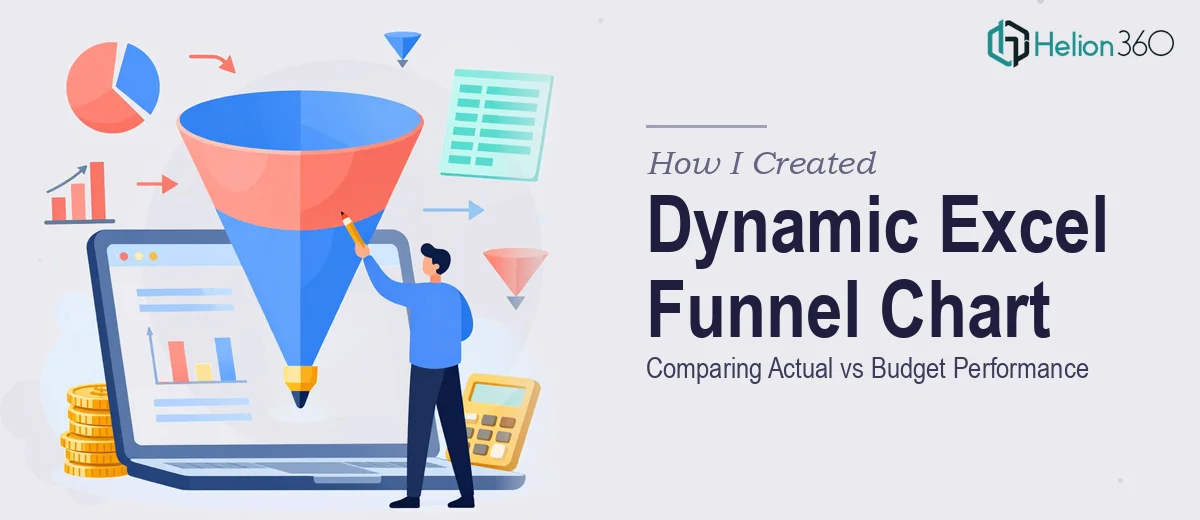
It started with what seemed like a straightforward ask from our marketing team: build a dynamic Excel funnel chart that shows actual versus budget performance at every stage of the sales funnel. Awareness, leads, qualified prospects, proposals, closed deals — each stage needed its own comparison, updated in real time as numbers came in.
I figured I could handle it. I've used Excel for years. Pivot tables, VLOOKUP, conditional formatting — none of that intimidates me. So I sat down and got to work.
Where Things Got Complicated
The first version I built looked fine on the surface. A basic funnel shape, actual numbers on one side, budget on the other. But the moment I tried to make it dynamic — linked to a live data table so values would auto-update — the chart started breaking. The funnel shape would collapse, bars would misalign, and the visual comparison between actual and budget became unreadable.
The core issue was that Excel's native funnel chart type does not natively support dual-series comparisons in a true funnel layout. I tried workarounds using stacked bar charts rotated to mimic a funnel shape. I experimented with phantom series to create the visual offset. Each attempt got closer but introduced new formatting problems — color inconsistencies, label overlaps, or data ranges that refused to stay linked properly.
I spent the better part of two days on this. The chart needed to be ready for a leadership review, and what I had was not presentation-ready by any standard.
Bringing in the Right Expertise
After hitting that wall, I reached out to Helion360. I explained the situation — the chart structure I was aiming for, the dynamic data requirement, and the tight deadline. Their team understood immediately. This was not the first time they had tackled an advanced Excel data visualization problem, and it showed in how quickly they asked the right clarifying questions.
They wanted to know how the source data was structured, whether the funnel stages were fixed or variable, and how the end user would be updating the numbers going forward. Those questions told me they were thinking about the full solution, not just the visual output.
What the Final Chart Actually Looked Like
The team at Helion360 came back with a funnel chart that genuinely worked. Each stage of the funnel displayed a clean side-by-side comparison — actual performance in one color, budget in another — with the funnel shape maintained across all stages regardless of value changes.
The dynamic element was handled through a structured data table where updating any cell automatically refreshed the entire chart. They also built in conditional formatting logic so that stages where actuals fell significantly below budget were visually flagged, making it easy to spot underperformance at a glance without digging into the numbers.
The chart used a combination of a custom bar chart structure with carefully calculated helper columns to simulate the funnel geometry. Labels were positioned cleanly, percentage variance was shown alongside each stage, and the whole thing scaled properly across different screen sizes.
What I Took Away From This
The experience clarified something I had been vague about before: Excel's charting tools are powerful, but advanced data visualization in Excel — especially dynamic charts with custom layouts — requires a level of formula and chart architecture knowledge that goes well beyond everyday use. The gap between a workable chart and a truly polished, functional one is real, and it is not always a gap you can close by spending more hours on YouTube tutorials when there is a deadline involved.
I also learned that getting the data structure right before building the chart is half the battle. The way the source table is organized determines what is even possible visually. That foundation work, which Helion360 handled as part of the build, made the chart maintainable long after delivery.
If you are working on a similar Excel data visualization project — whether it is a funnel chart, a variance analysis dashboard, or any kind of actual vs budget comparison — and the complexity is outpacing your available time, Helion360 is worth reaching out to. They handled what I could not get across the finish line and delivered something the team actually used.