
How I Created a Custom Sales Forecasting Excel Sheet for a Food Tour Business
Learn how to summarize Excel data into a compelling PowerPoint presentation — covering structure, chart choices, formatting rules, and common pitfalls to avoid.
Read MorePresentation design, digital marketing & market research for businesses worldwide.
Loading blog…
Learn how to summarize Excel data into a compelling PowerPoint presentation — covering structure, chart choices, formatting rules, and common pitfalls to avoid.
Read MoreLearn how to build an automated Excel dashboard that consolidates scattered inventory and sales data with filtering, reporting, and outreach integration.
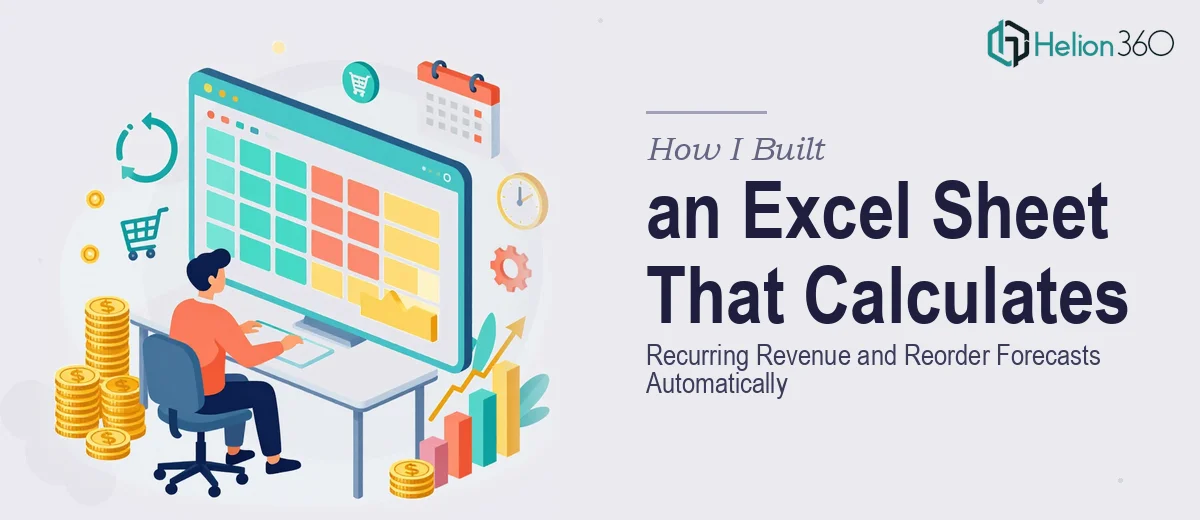
Read MoreLearn how to build an Excel model that automatically calculates recurring revenue and reorder forecasts — with real formulas, structure, and decision rules.
Read MoreLearn how to build a comprehensive Excel reporting sheet to track revenue, expenses, and inventory with real formulas, structure tips, and common pitfalls.
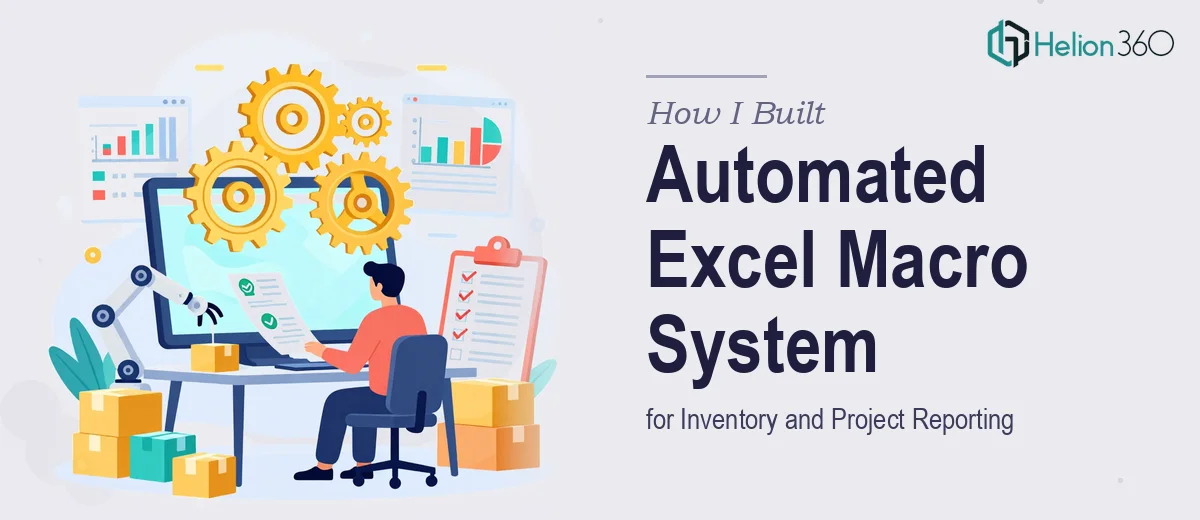
Read MoreLearn how to build an automated Excel macro system for inventory and project reporting — structure, VBA logic, pitfalls, and real decision rules explained.
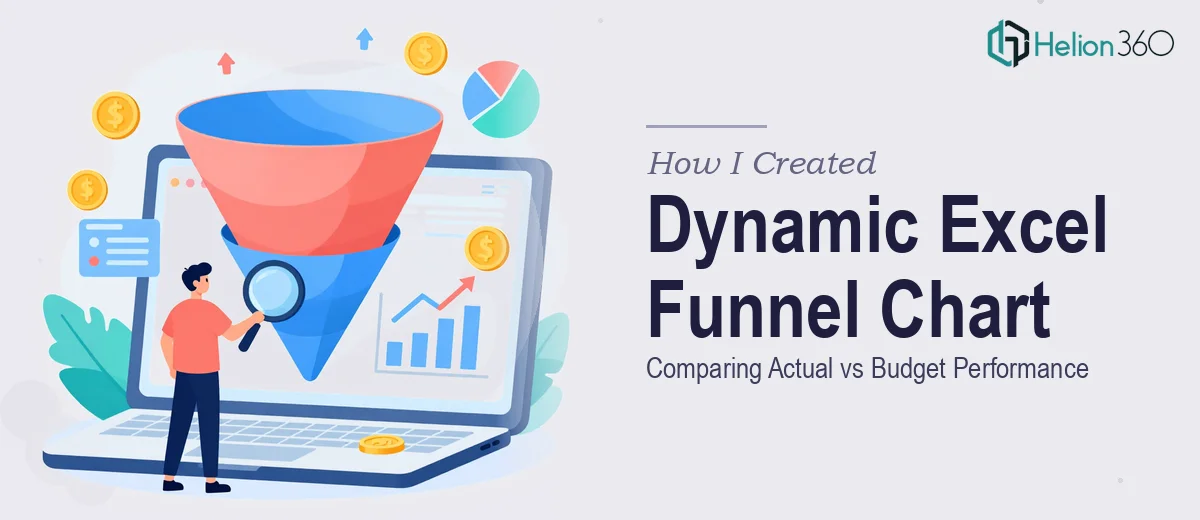
Read MoreLearn how to build a dynamic Excel funnel chart comparing actual vs budget performance — with real formulas, chart settings, and common pitfalls to avoid.
Read MoreLearn how to build a custom Excel function that queries APIs and returns dynamic tables — covering LAMBDA, Power Query, and data structuring best practices.
Read MoreLearn how to build scalable Excel functions that analyze multi-regional sales data accurately — including formulas, structure, and common pitfalls to avoid.
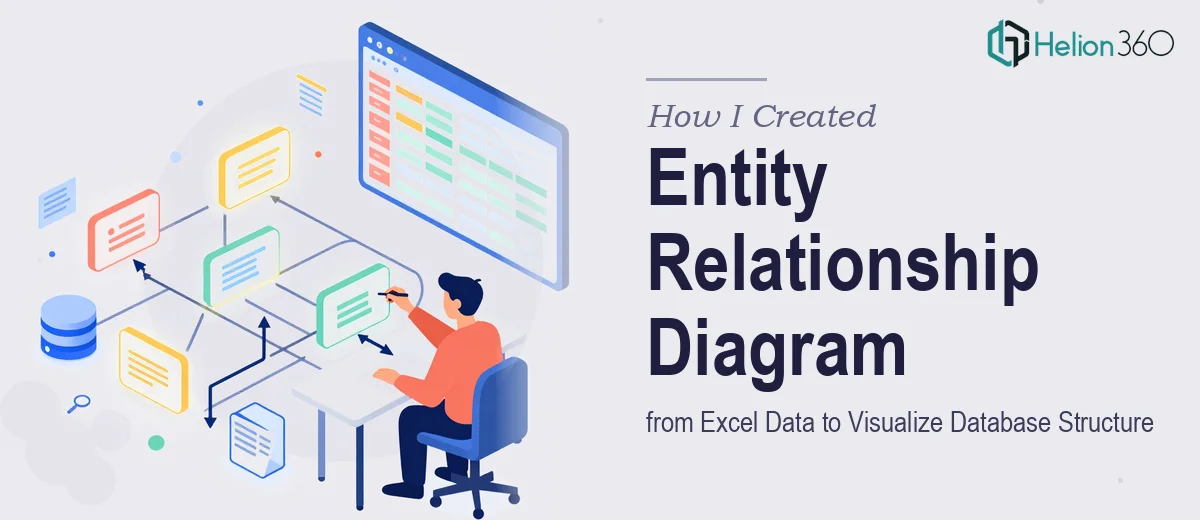
Read MoreLearn how to convert raw Excel data into a clear entity relationship diagram. Understand structure, tools, and common pitfalls in database visualization.
Read MoreLearn how to build an interactive Excel dashboard that tracks KPIs across multiple data sources — with real formulas, layout rules, and pitfalls to avoid.
Read More