14May
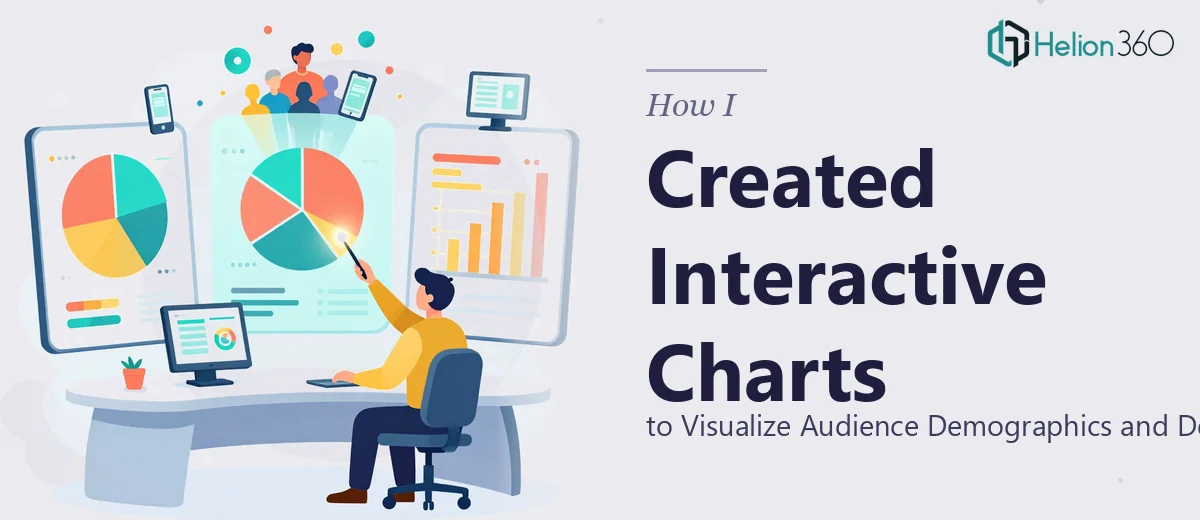
How I Created Interactive Charts to Visualize Audience Demographics and Device Behavior
Learn how I organized birthday, gender, and device data into clear bar and pie charts for a marketing campaign — and how Helion360 made it work.
Read More

Presentation design, digital marketing & market research for businesses worldwide.
Loading blog…
Learn how I organized birthday, gender, and device data into clear bar and pie charts for a marketing campaign — and how Helion360 made it work.
Read More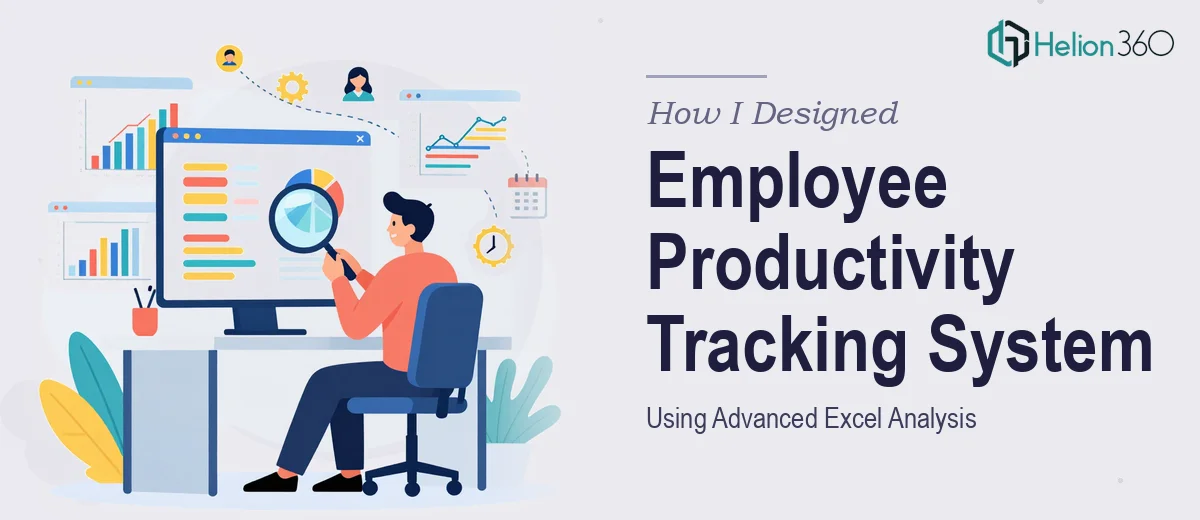
How I built an employee productivity tracking system using advanced Excel data analysis — and what happened when the complexity exceeded my bandwidth.
Read More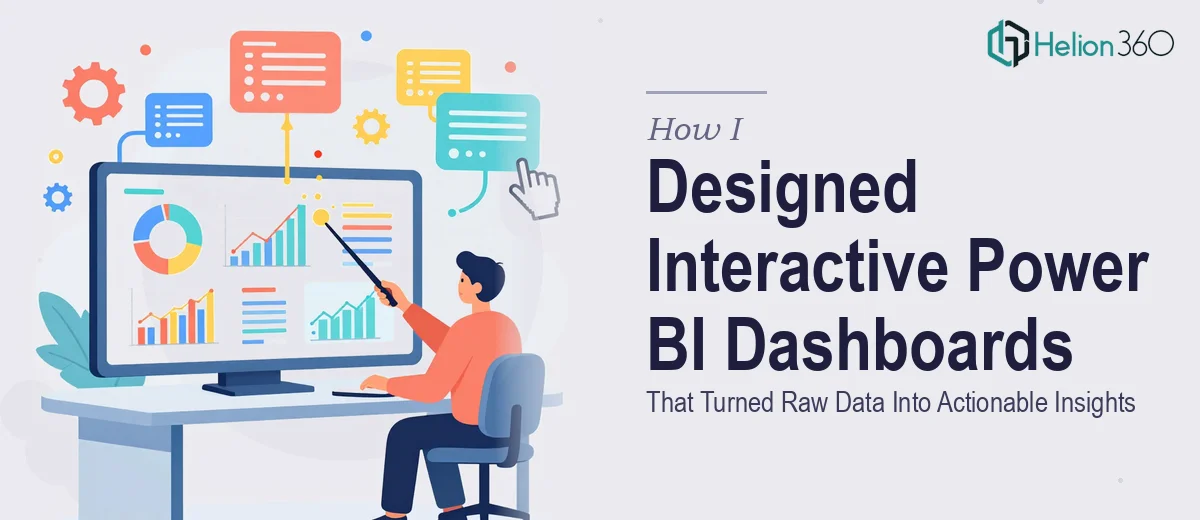
How I tackled messy raw data and worked with Helion360 to build interactive Power BI dashboards that made business metrics finally make sense.
Read More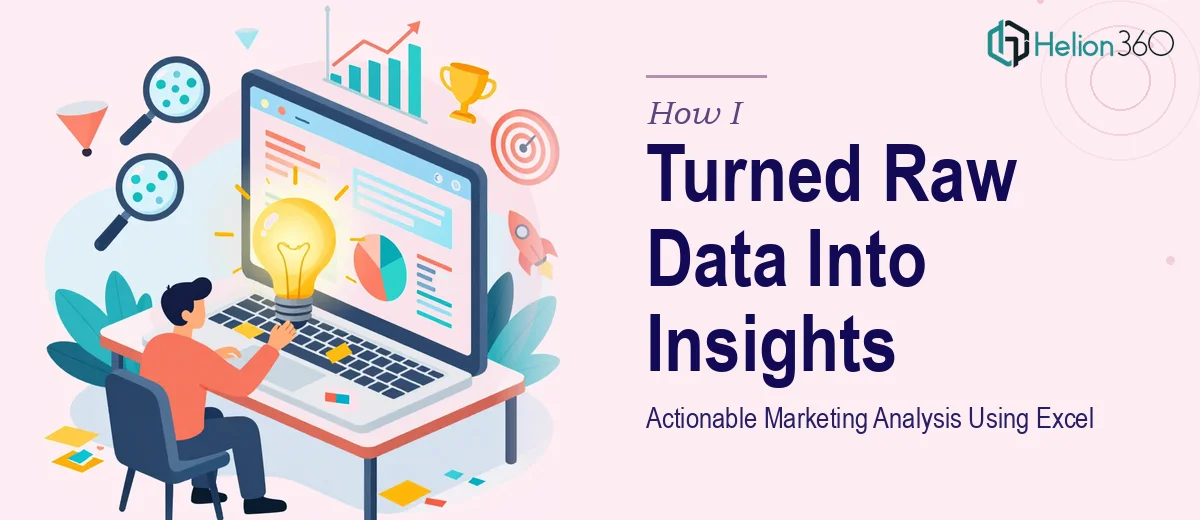
Learn how I processed large marketing datasets in Excel, derived actionable insights, and got professional help to turn the analysis into clear, usable reports.
Read More
How I tackled large Excel datasets, ran statistical analysis, and used SQL and Tableau to uncover real business insights — with help from Helion360.
Read More
How I used Python, SQL, and Excel automation to turn messy startup data into clear growth insights — and where I needed expert help to finish the job.
Read More
How I handled accounts receivables for a busy marketing agency using QuickBooks and Excel — and what I learned when the volume got too complex to manage alone.
Read More
How I tackled a high-volume lead data migration from LinkedIn and ZoomInfo into Excel — and why I brought in outside help to get it done right.
Read More
How I tackled a complex data analytics project using SQLite, Power BI, Python, Jupyter, and Orange — and what helped me get it done right.
Read More
How I set up a robust Excel analytics system to track community performance, pull data from multiple sources, and generate actionable insights for a growing startup.
Read More