23Jul
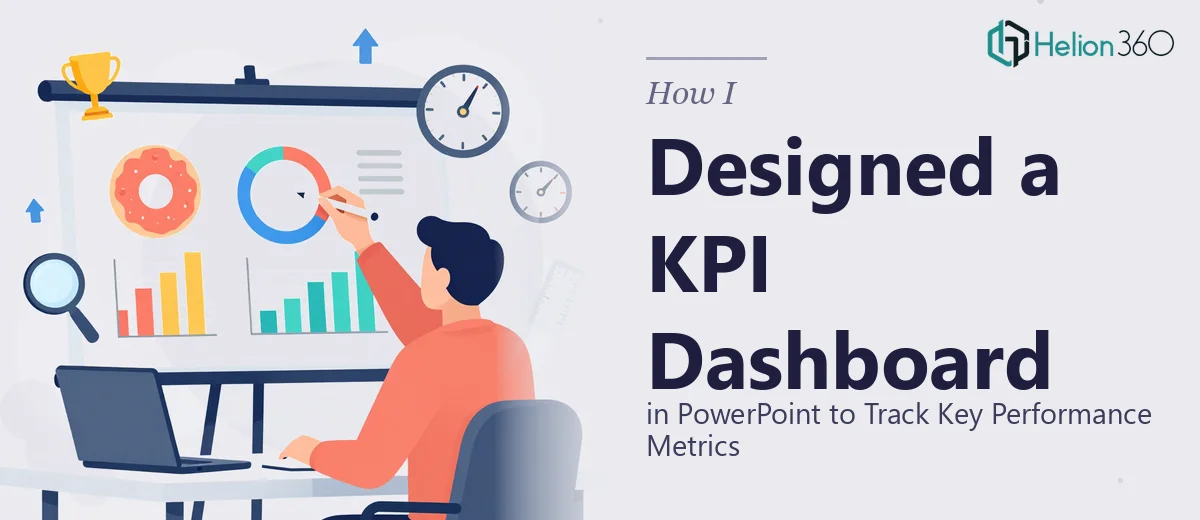
How I Designed a Clean KPI Dashboard in PowerPoint to Track Key Performance Metrics
Learn how to design a clean, functional KPI dashboard in PowerPoint that tracks key performance metrics clearly and communicates results with impact.
Read More

Presentation design, digital marketing & market research for businesses worldwide.
Loading blog…
Learn how to design a clean, functional KPI dashboard in PowerPoint that tracks key performance metrics clearly and communicates results with impact.
Read More
Learn how to synthesize scattered research findings into a clear, compelling executive report with actionable insights stakeholders will actually use.
Read More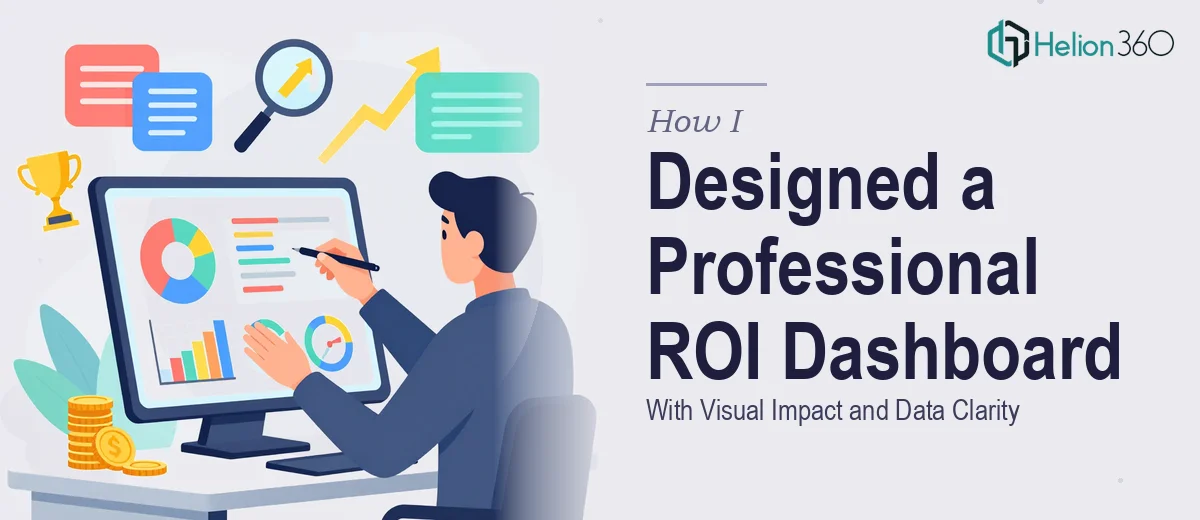
Learn how to design a professional ROI dashboard slide that communicates performance clearly, with the right layout, charts, and data visualization principles.
Read More
Learn how to design a four-quadrant analytics dashboard that simplifies quarterly business reporting with clear data visualization and smart layout principles.
Read More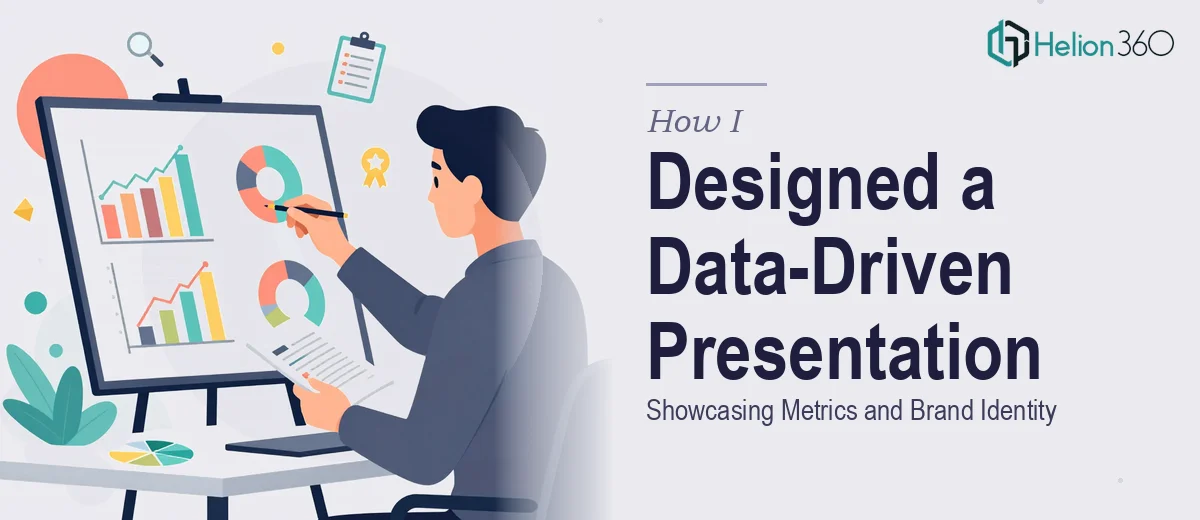
Learn how to design a data-driven PowerPoint presentation that balances financial metrics, data visualization, and consistent brand identity across every slide.
Read More
Learn how to design a dynamic pricing table in Excel for contract management — with real formulas, structure tips, and common pitfalls to avoid.
Read More
Learn how to convert complex PDFs into a polished PowerPoint presentation — structure, formatting, data handling, and common pitfalls explained in depth.
Read More
Learn how to convert multi-page PDFs into polished landscape PowerPoint presentations with embedded charts, images, and data visuals — done right.
Read More
Learn how to transform complex cloud SaaS reports into clear, compelling PowerPoint presentations that communicate data effectively to any audience.
Read More
Learn how to distill dense research into a clear, compelling PowerPoint presentation — structure, data visualization, and common pitfalls explained.
Read More