
How to Build Excel Charts That Track Sustainability Metrics in Real Time
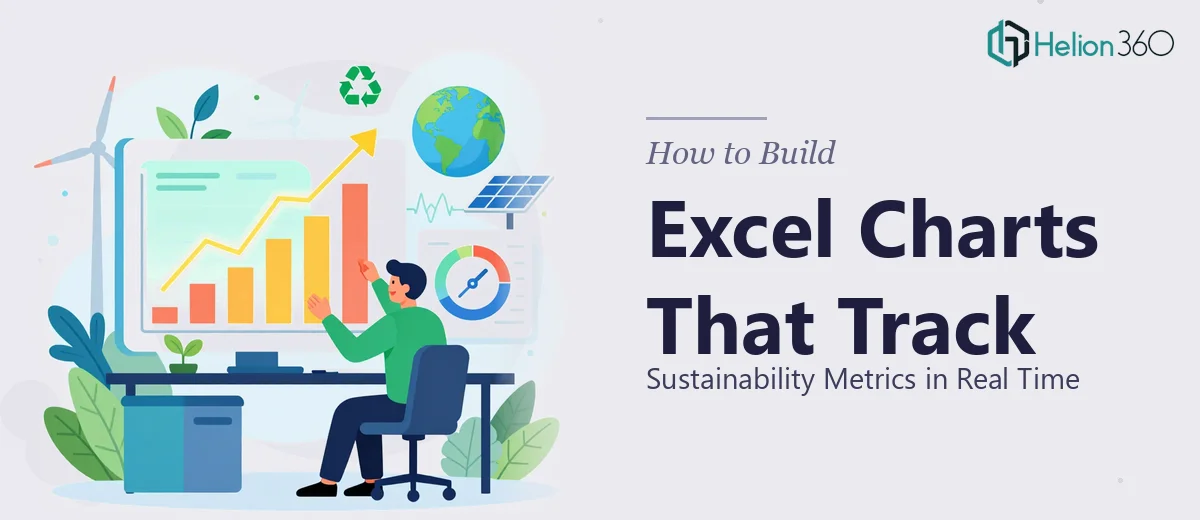
Learn how to build dynamic Excel charts that track sustainability metrics in real time — with formulas, chart types, and dashboard structure that actually works.
Read MorePresentation design, digital marketing & market research for businesses worldwide.

Loading blog…
Learn how to build dynamic Excel charts that track sustainability metrics in real time — with formulas, chart types, and dashboard structure that actually works.
Read MoreLearn how to build a Power Automate workflow that extracts PDF data into Excel accurately — including tools, logic, pitfalls, and real configuration details.
Read MoreLearn how to manage large-scale Arabic financial data entry in Excel with 100% accuracy — tools, structure, validation rules, and common pitfalls explained.
Read MoreLearn how to accurately extract data from scanned PDFs into Word and Excel — with structure, formatting rules, and quality checks that make the data usable.
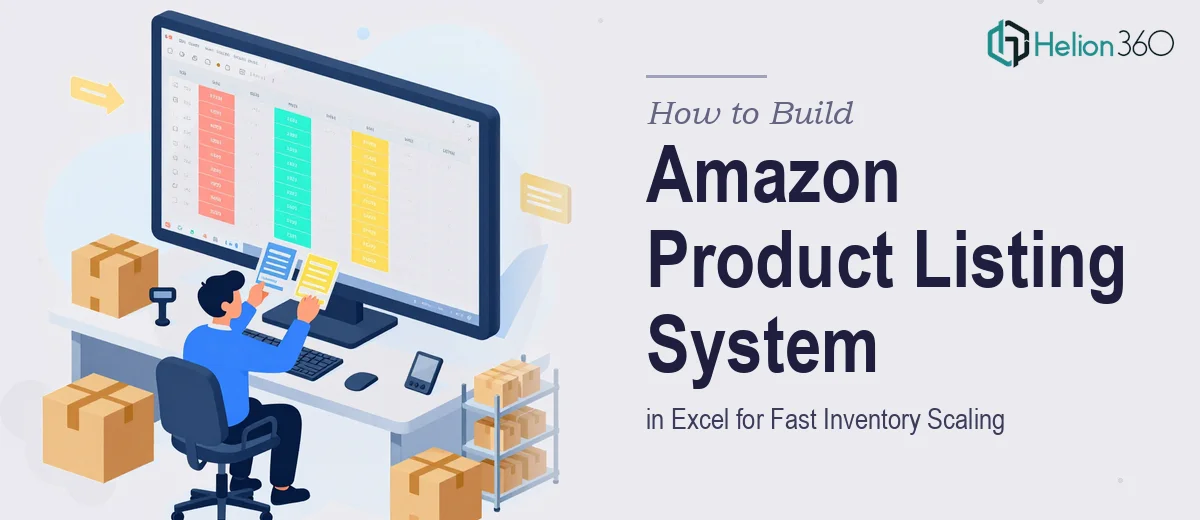
Read MoreLearn how to build a multi-variation Amazon product listing system in Excel that scales fast — with real formulas, naming conventions, and structure tips.
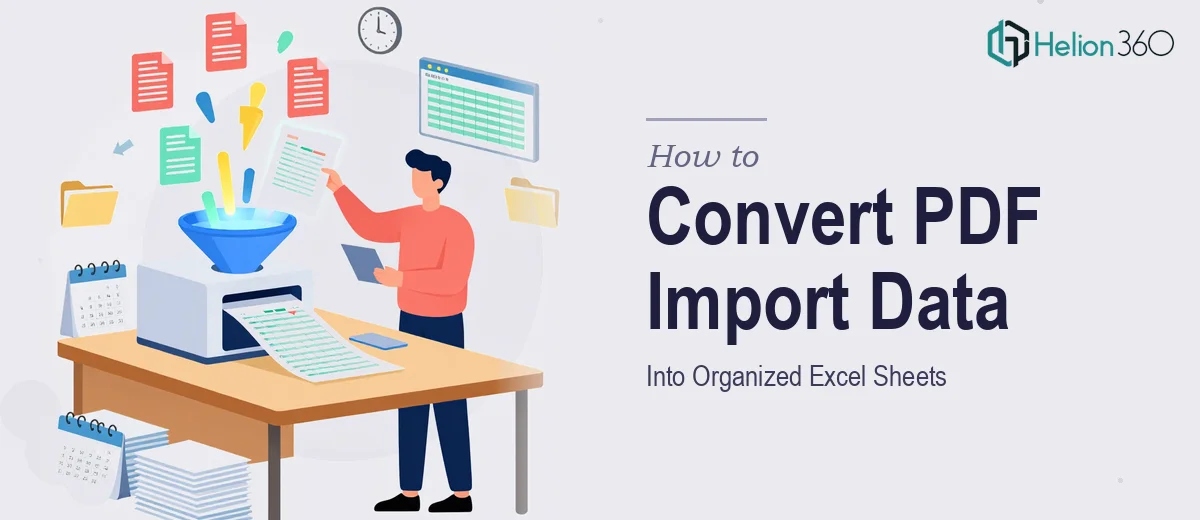
Read MoreLearn how to convert 36 months of PDF import data into clean, organized Excel sheets — with real formulas, structure rules, and common pitfalls to avoid.
Read MoreLearn how to extract product and supplier data from Alibaba and Made-in-China using Python, BeautifulSoup, and Scrapy — then structure it cleanly in Excel.
Read MoreLearn how to clean up, format, and finalize an Excel file the right way — from formula audits to layout polish and version control.
Read MoreLearn how to move from Excel to Power BI the right way — data modeling, DAX measures, dashboard design, and common pitfalls to avoid.
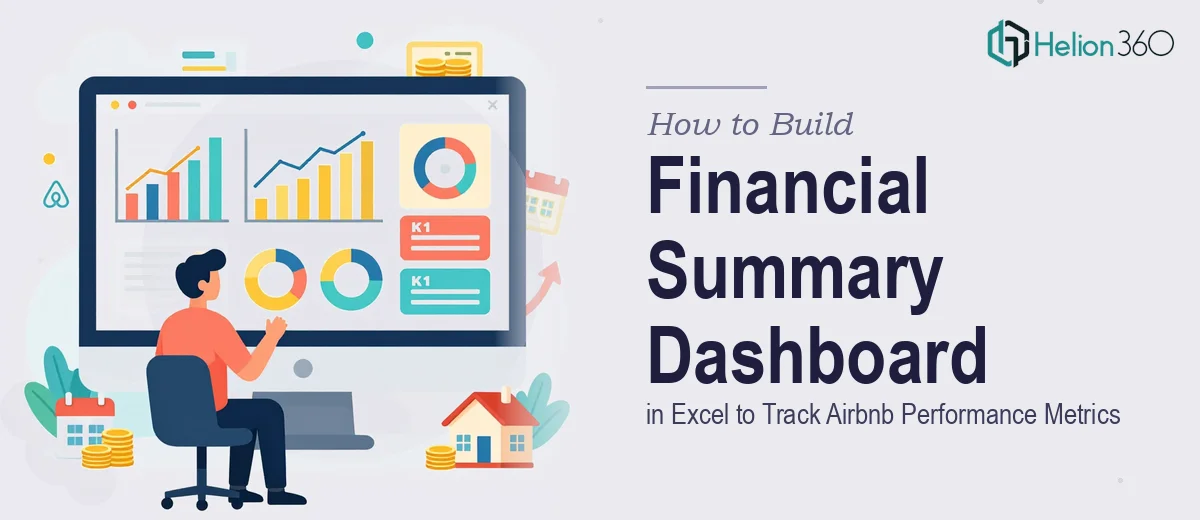
Read MoreLearn how to build a financial summary dashboard in Excel to track Airbnb revenue, occupancy, and performance metrics with real formulas and structure.
Read More