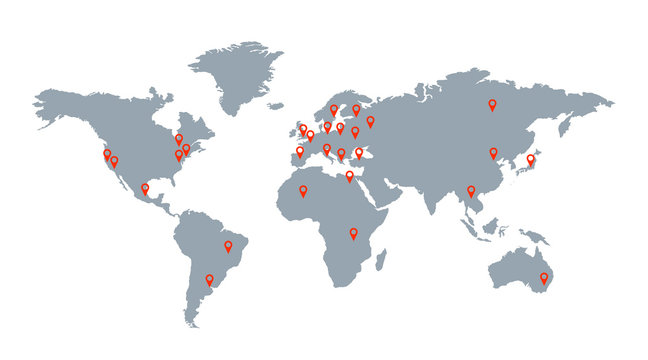
Data Visualization Toolkit
Build data visualization toolkits that transform raw data into clear, impactful visuals

934
Clients Served
95%
Repeat Clients
48 hrs
Avg Delivery Time
99.4%
Success Rate
Why Choose Us
We create data visualization solutions that convert complex data into clear, insightful visuals with consistent and professional design. Our approach makes data easier to interpret and present.
We convert complex data into clear visuals that highlight key insights.
Standardized visual styles that improve readability and presentation quality.
High-quality outputs with attention to detail and quick turnaround.
Testimonials / Client Reviews
Highly recommended for anyone seeking top-notch presentation services. Helion 360 creates dynamic slides that delivered beyond my expectations. Great attention to detail and extremely flexible creating different options to ensure slides resonate and are impactful. The turnaround time is impressive, and the team's professionalism was evident throughout the process.
Excellent Service Helion360 were very helpful and quick in responding and helping to customize our content. They did an excellent job with our template and formatting.
Helion360 - Responsible company with good quality output Helion360 does a great job with turning around professional slides based keeping it consistent with theme we have established with them. Responsible company with good quality output…
Excellent Custom Slide Service by Helion360 I recently worked with Helion360 for custom slides design for my company, and was thoroughly impressed. Their team was professional, creative, and responsive throughout the process. They took the time to understand our needs and delivered a visually stunning and impactful slide that perfectly aligned with our brand. The communication was top-notch, and they were accommodating to our feedback. I highly recommend Helion360 for anyone in need of high-quality custom slide designs. Great job, Helion360, and thank you for your outstanding service!
Process
Understand your data types, use cases, and visualization objectives
Prepare datasets and refine existing visuals if available
Select appropriate visualization formats and organize insights logically
Create clean, consistent, and visually engaging charts and graphics
Refine based on feedback and deliver final toolkit ready for use
Frequently Asked Questions

Submit a Quick Request
We value your time and will make every effort to accommodate your request as soon as possible.


