

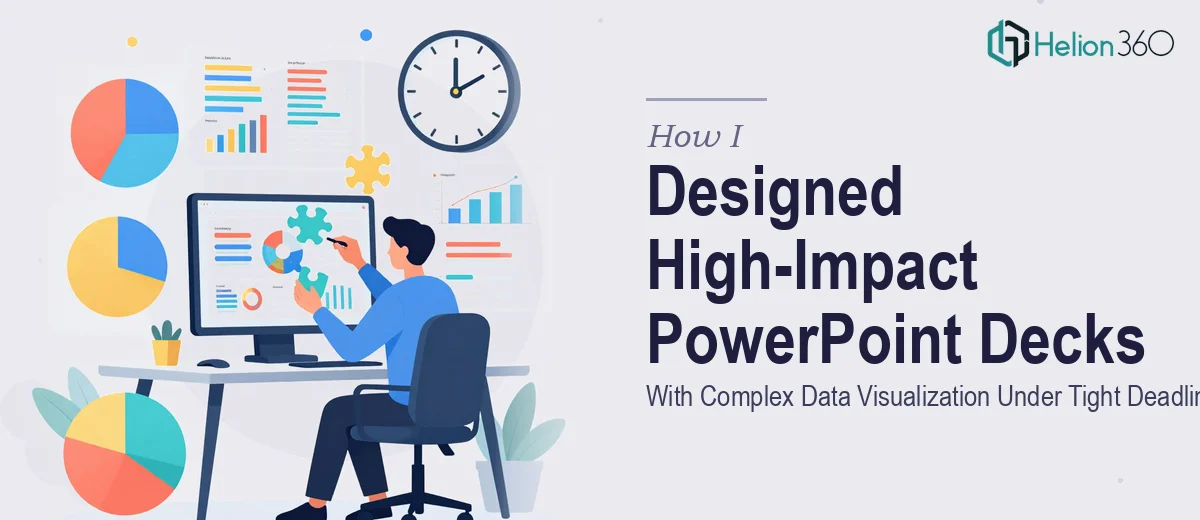
When Good Data Meets a Bad Deadline
I had about two weeks to pull together three major PowerPoint decks for back-to-back internal reviews and a client-facing presentation. Each deck carried a different audience, a different message, and a significant amount of raw data that needed to communicate clearly and quickly. That combination — complex data visualization, multiple decks, and very little time — was more than I had anticipated.
I knew PowerPoint well enough for everyday use. But what these projects demanded was something different. The data sets were dense, the charts needed to tell a story rather than just display numbers, and the slides had to look polished enough to hold their own in a competitive environment.
Where I Hit the Wall
I started by drafting the first deck myself. I built the structure, pulled in the data, and dropped in standard charts. The problem was that nothing felt cohesive. The charts looked like charts — not like insights. The slides felt disconnected, and the visual hierarchy was all over the place. I could see what the data was saying, but I could not make the slides say it.
Interactive elements were another issue entirely. One of the decks needed a navigator-style layout where the audience could follow a flow without getting lost. I had a rough idea of how it should work, but executing it cleanly in PowerPoint — without it looking clunky or amateur — was beyond what I could pull off in the time available.
I also kept second-guessing layout decisions. Should the chart lead the slide or follow the headline? How much white space is too much? When does simplifying a visual actually lose the meaning? I was spending time on questions I did not have time to answer.
Bringing in the Right Support
After losing two days going in circles, I reached out to Helion360. I explained the situation — three decks, tight deadline, complex data, and a need for consistent design across all of them. Their team asked the right questions upfront: what was the audience for each deck, what actions did I want each presentation to drive, and what brand or style constraints were in play.
That intake process alone gave me confidence that this was going to be handled properly. They were not asking me to hand over raw slides and hope for the best. They were thinking about the communication goal first, and the design second.
What the Final Decks Looked Like
Helion360 rebuilt the first deck from the ground up while keeping my content and structure intact. The data visualization work was exactly what the projects needed. Charts that had looked flat and disconnected were restructured as narrative visuals — each one staged to lead the viewer's eye toward the key insight before they even read the label.
The interactive deck came together cleanly. Section navigation, anchor links, and a visual flow that made the presentation feel guided rather than linear. It did not feel like a trick — it felt like a well-organized document that happened to be interactive.
Across all three decks, the design language was consistent. Font choices, color use, spacing, and iconography all reinforced the same visual identity without anyone having to manually enforce it slide by slide.
What I Took Away From This
The work I had been struggling with was not complicated because the data was too hard — it was complicated because translating dense information into clear, visual storytelling is a specific skill. Knowing what a good slide should do and knowing how to build one are two different things.
Deadlines do not leave room to develop that skill on the fly. The decks I needed had to compete with polished, professional-grade presentations, and that required a level of PowerPoint design expertise I simply did not have available in-house at that moment.
The outcome spoke for itself. All three presentations landed well. The data-heavy slides were easy to follow, the interactive deck drew positive comments from the audience, and the consistent visual design made the whole set feel like it came from one coherent, credible team.
If you are dealing with the same kind of situation — complex data that needs to become a compelling presentation, and not enough time to figure it out yourself — Helion360 is worth contacting. They stepped in at the right point and delivered exactly what was needed, without overcomplicating the process. Learn more about how raw data transforms into interactive dashboards to see what's possible when you have the right support.