
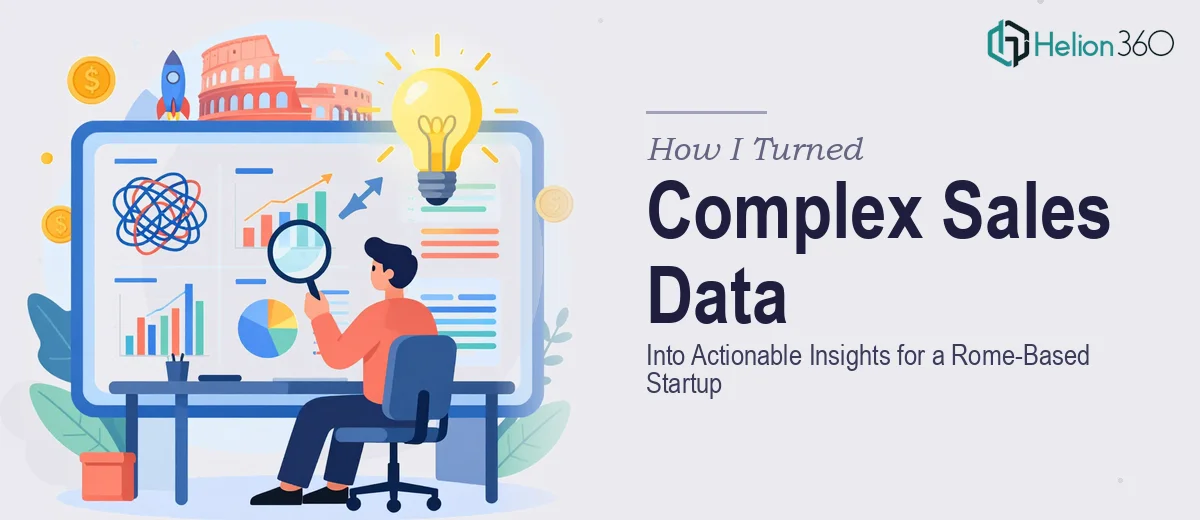
How I Turned Complex Sales Data Into Actionable Insights for a Rome-Based Startup
How I tackled messy sales data, customer behavior patterns, and market trends for an Italian startup — and what made the final presentation actually work.
Read MorePresentation design, digital marketing & market research for businesses worldwide.
Loading blog…
How I tackled messy sales data, customer behavior patterns, and market trends for an Italian startup — and what made the final presentation actually work.
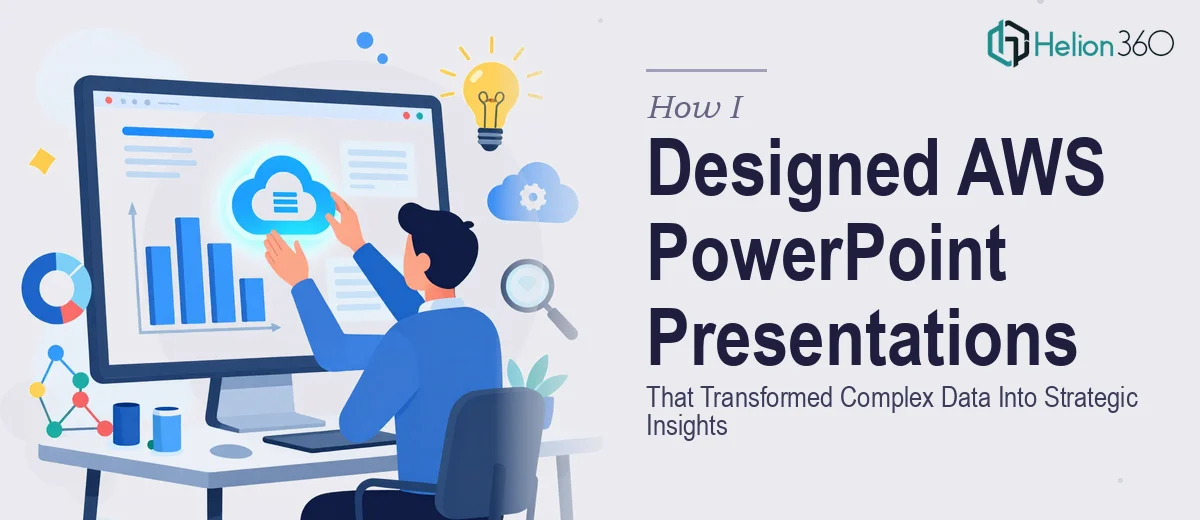
Read MoreHow I turned dense AWS performance data into clear, strategic PowerPoint presentations for a tech team — and what made the difference in the final result.
Read MoreStruggling to build accurate charts for an important presentation? Here's how I handled complex data visualization and got professional results fast.
Read MoreLearn how I transformed raw business data into clear, visually stunning graphs and charts for high-stakes presentations — and what made the difference.
Read MoreI needed 4 product launch presentation slides that could tell a data story visually. Here's how the work got done and what made the difference.
Read MoreI needed to turn complex tech startup data into compelling presentation graphics. Here's how the process unfolded and what finally made it work.
Read MoreHow I turned a dense set of product launch statistics into a clean, high-impact infographic — and what I learned when the complexity exceeded my capacity alone.
Read MoreStruggling to present complex data analysis to stakeholders? Here's how I transformed dense reports into clear, actionable presentations that decision-makers actually understood.
Read MoreSee how I tackled abstract AdTech ideas through visual design — and how Helion360 helped turn complex concepts into clear, compelling graphics.
Read MoreHow I tackled complex graph representations in Python using NetworkX and Matplotlib — and what I learned when the project outgrew my solo capacity.
Read More