29Jun
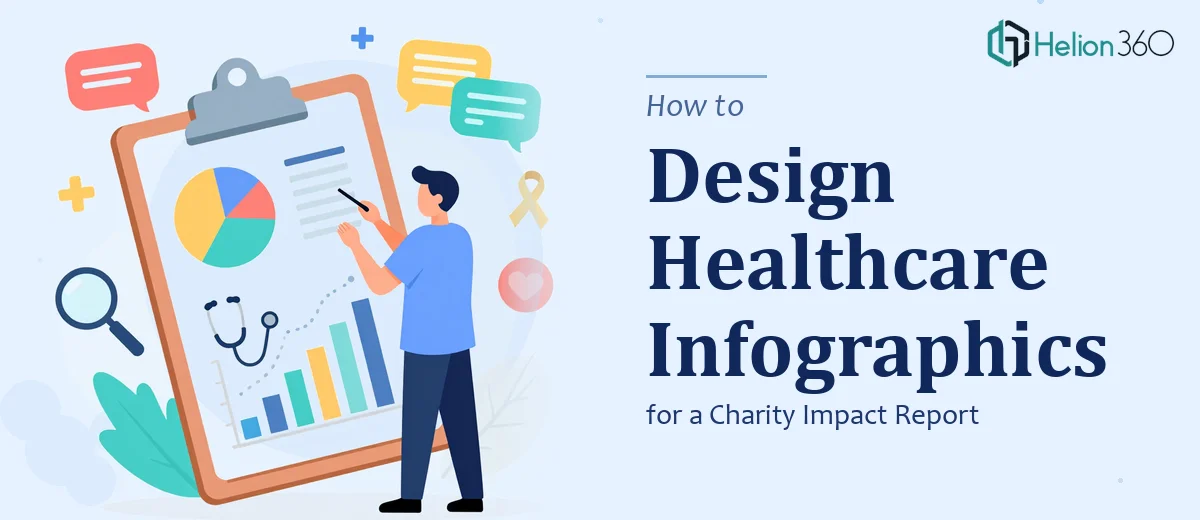
How to Design Infographics for a Healthcare Charity Impact Report
Learn how to design compelling infographics for a healthcare charity impact report — from data visualization strategy to layout, typography, and common pitfalls.
Read More

Presentation design, digital marketing & market research for businesses worldwide.
Loading blog…
Learn how to design compelling infographics for a healthcare charity impact report — from data visualization strategy to layout, typography, and common pitfalls.
Read More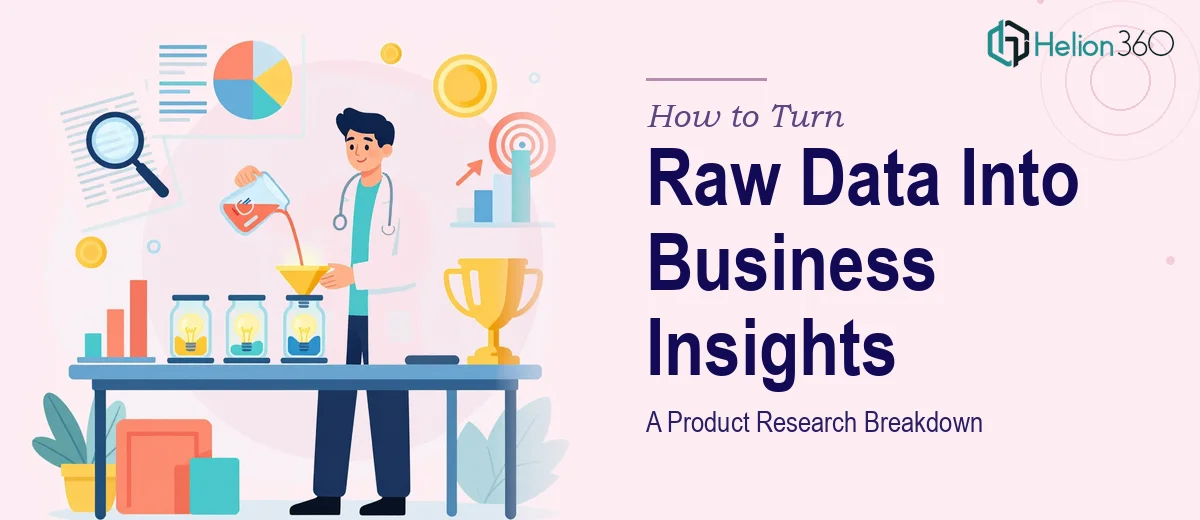
Learn how to transform raw product research data into actionable business insights using structured analysis, data visualization, and market trend frameworks.
Read More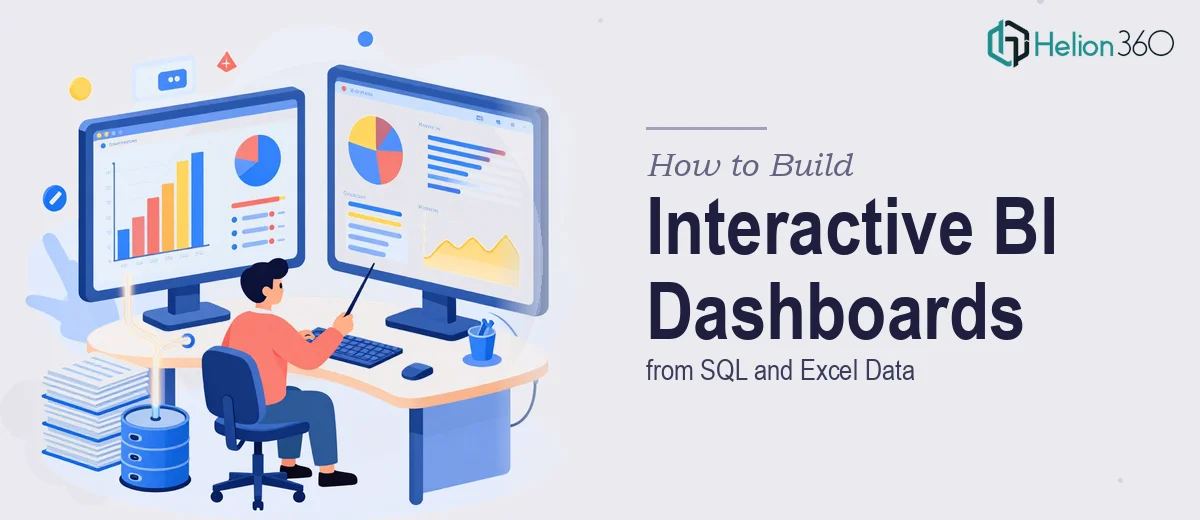
Learn how to build interactive Power BI and Tableau dashboards using SQL and Excel data — covering data prep, modeling, visualization, and common pitfalls.
Read More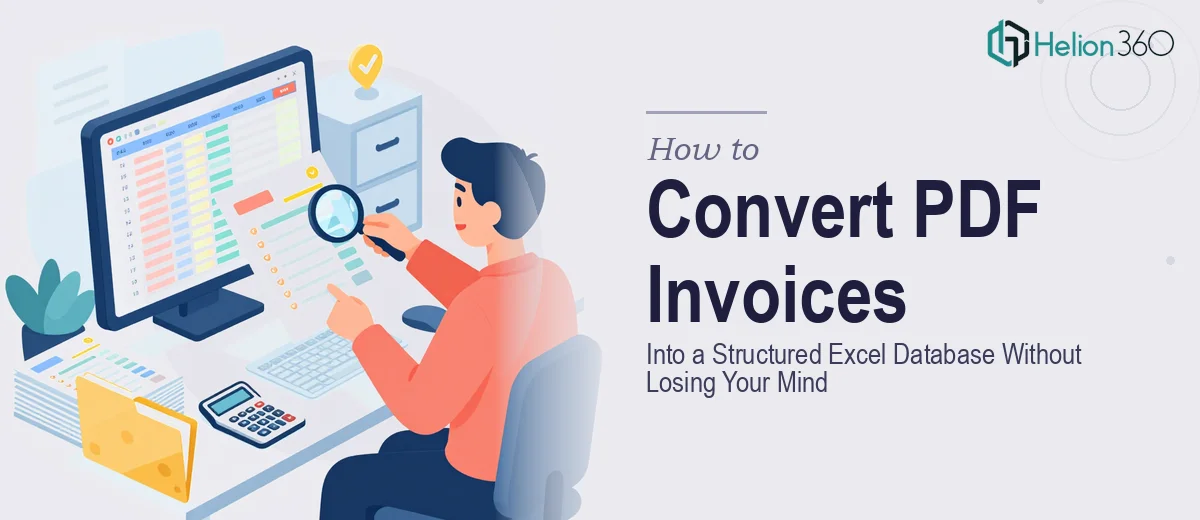
Learn how to convert PDF invoices into a clean, organized Excel database. Covers tools, data structure, formulas, and common pitfalls to avoid.
Read More
Learn how to approach complex big data analysis using SPSS, R, and Excel — tools, formulas, workflows, and common pitfalls explained in depth.
Read More
Learn how to turn a tech startup's key messages into a polished 60-second infographic video — structure, visuals, pacing, and common pitfalls explained.
Read More
Learn how to structure complex data analysis for healthcare equity research using advanced Excel functions, logical formulas, and financial modeling best practices.
Read More
Learn how to use Python with pandas and openpyxl to automatically add columns to exported Excel files and streamline your data preparation workflow.
Read More
Discover what an animated map presentation actually requires — from cartographic scripting to motion design — and why engaging the right team makes all the difference.
Read More
Designing a scientific infographic for educational use is harder than it looks. Here's what the work really involves — and how I got it done fast.
Read More